|
Apple is currently one of the largest positions in Fundamental Value, Bireme's US equity strategy. Therefore, it was with intense interest that we read a recent short thesis on Apple posted at the Value Investor’s Club. (Note: you must create a guest account at VIC to view.)
We disagree with much of that piece, and thought an effort to refute it could make for an interesting first blog post of our own. To be clear, the point of this post is not to present a full long thesis on Apple, but merely to knock down the bearish arguments in the link above.
The VIC post discussed a number of “challenges facing Apple.” Each will be addressed in turn:
The Declining Userbase and Implications for the Moat In the VIC post, the author spends a few pages describing Research in Motion's decline. He then tries to tie this to Apple, pointing to 2016 iPhone unit volume declines: 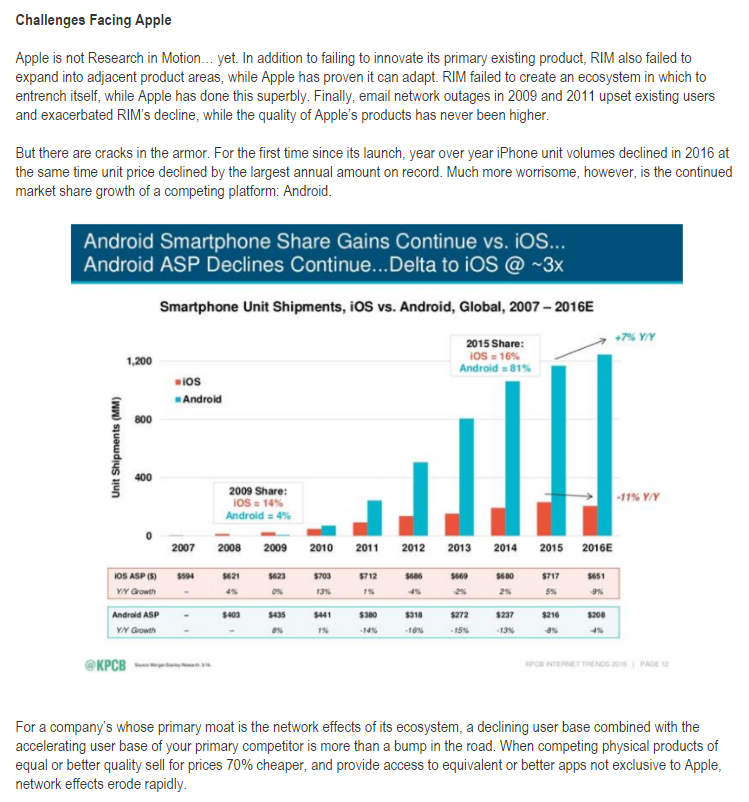
The author’s logic regarding Apple’s declining user base seems to be as follows:
#1: 2016 iPhone volumes The author fails to note that not every iPhone upgrade is the same. Generally, iPhone upgrade cycles follow a tick-tock cycle, where one large upgrade (this upgrade gets a new number, e.g. “iPhone 5”) is followed by a lesser “S” upgrade. Full upgrades pull demand forward, away from the “S” upgrade years. Not only was the iPhone 6 of FY 2015 a full upgrade, but it involved a change in form factor (a larger screen) as well. This is important because consumers had been waiting for a larger screen iPhone for years. In China specifically, nearly 50% of the smartphone market had screen sizes of >4.5 diagonal inches in mid 2013 per IDC. The iPhone 5s, released in 2013, was 4 inches across: tiny by Chinese standards. By the time the iPhone 6 was released in late 2014, Samsung was already on the 4th version of the popular and much larger Galaxy Note series. The bigger iPhones satisfied a lot of pent-up demand, and FY 2015 iPhone unit sales were up 37%, a much larger change than FY 2013’s 20% unit increase for the iPhone 5. It is not surprising that 2016 units would decline from such a large peak. Yet despite the decline from 2015, FY 2016 iPhone unit sales were still 25% higher than those sold in FY 2014. Only if 2017 and 2018 unit sales decline from the levels of 2015 and 2016 will an important trend be formed. But we are far from that point. #2: Declining unit sales and ecosystem size But even if unit sales were to consistently decline, that could still mean a growing installed base. To see why, let’s look at the two types of people that buy iPhones:
The percentage of iPhone users replacing their phones (#2 buyer type above) in any one year is called the replacement rate. This rate has a big impact on unit sales, even though replacements have zero direct impact on the installed base. And what we see from usage and subscriber data is that, despite the recent decline in unit sales, there are more iPhone users in 2017 than there were in 2015, with Apple’s share of usage flat or up. This is true even in China, where Apple saw the largest sales decline in 2016.
Other analysts agree that what we are seeing is an increase in the installed base and perhaps a lengthening replacement cycle, despite the slowdown in sales:
While a slowing replacement rate is not bullish for unit sales, a growing installed base is a positive for Apple’s service revenues. This segment consists of revenue Apple gets from iTunes downloads and subscriptions, Apple Care, Apple Pay, and iCloud. It has been growing briskly, further demonstrating the health of the installed base. In fact, this segment is so robust that it alone generates more revenue than some very highly valued software companies. For example, in terms of sales, it is larger than Chinese software giant TenCent, maker of the most popular Android app store in China. 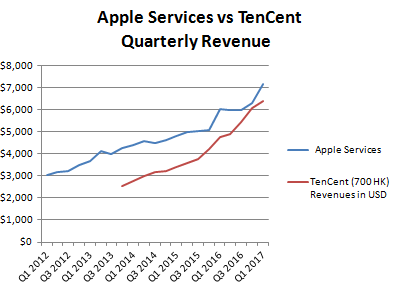
TenCent’s market capitalization is $231 billion US dollars.
#3: Apple’s moats Apple has significant competitive advantages that are entirely separate from the size of its ecosystem. The biggest one is the lack of fragmentation in their mobile OS and devices. Because Apple manufactures their own hardware and thus controls the final software version in their phones, new versions of iOS can be released to all of their devices concurrently. This is not true for Android, where the handset OEMs must make tweaks to the software to get it to work properly on the hundreds of device models that are in use. Many of them even make additional functional changes, such as HTC’s Sense Android-based user interface. Due to this additional layer of software development, Android users generally have to wait for both the hardware manufacturer, and sometimes the network operator, to put their spin on the latest Android release. This can lead to multi-year delays in Android operating system updates. We can see the results of these two business models by looking at iOS and Android OS version usage. For Android, only 3% of users are on Nougat, the latest version of Android, and 34% are on either of the last two named versions. In contrast, 79% of iPhone users are on the latest release, iOS 10, and 95% of iOS users are on one of the last two versions. There are important implications of Android’s OS fragmentation. The most obvious result is that the majority of Android users must make do with older, presumably less functional software. They are trapped on the Android equivalent of Windows Vista. Fragmentation is also important for app developers. By developing for the latest version of iOS, you can hit most Apple users. Not so if you choose to develop on Nougat. If you want to develop for either of the two most recent versions, Apple’s ecosystem has a ~3x advantage on Android relative to the size of the user base. But an Android developer must deal not just with fragmented operating system software, but with fragmented hardware as well. In terms of form factor alone, Android’s Supporting Multiple Screens guide groups phones into four different sizes and six different pixel densities, creating 24 different combinations of the two. iPhone has 3 sizes (4”, 4.7”, and 5.5”) and 2 pixel densities (326 and 401 ppi) across the iPhone 5s, iPhone 6, iPhone 6 Plus, iPhone 6s, iPhone 6s Plus, iPhone 7, iPhone 7 Plus, and iPhone SE. The possible combinations for Android phones gets truly staggering when you consider variances in storage and memory, processor chipsets, and connectivity technology. The ability to develop for one operating system and a small number of form factors makes a developer’s job much easier. One investigation by a software firm found that Android development takes about 30% longer than the same job on iOS. But ease of development is not the only reason to focus on iOS. Developers also make more money on iOS. App Annie estimates that iOS brought in $34 billion in 2016, double the $17 billion generated by the Google Play Store, and also larger than the combined $27 billion from Google Play and third-party Android stores combined. This disparity in both ease of development and financial incentives leads to equal or better applications available on iOS, despite Google’s 4x lead in unit share. This is a big part of Apple’s moat. Even Google itself has been accused of making better apps for iOS than for Android. Apple’s Closed Ecosystem From the original: 
First of all, is Apple’s ecosystem closed where it matters?
Any developer can make an application for iOS. And millions have. If you are a business thinking about whether you have access to Apple’s customers, the answer is almost always “yes”. You must merely make an application that conforms to Apple’s rules, which protect the security and user experience of its customers. Apple’s system is closed, or as we prefer, vertically integrated, in some ways. They do not let network operators tinker with their software, and they certainly do not let OEMs put iOS in new hardware. The downside for consumers is that iOS software will only be available in a limited number of form factors that Apple chooses to support. So if you would like iOS 10 on a 5.9” phablet, you are out of luck for now. Here they make a conscious tradeoff between form factor choice and user/developer experience. It is this tradeoff that led Google to develop the fully integrated Pixel phone, despite their historical promotion of Android as an open platform. From an article at The Verge discussing the phone’s development: "Fundamentally, we believe that a lot of the innovation that we want to do now ends up requiring controlling the end-to-end user experience," [Google Head of Hardware] Osterloh says. It’s the kind of sentiment you usually hear from Apple, not Google. Google’s efforts (and success!) to control the phone experience end-to-end show the merits of Apple’s approach, and demonstrate that the approach is not “shortsighted” as the VIC author claims. In fact, all of the competitors named by the author except Netflix made an attempt to build a “closed” phone ecosystem, despite their supposed preference for openness. It is telling that Amazon, Facebook, and Microsoft all failed miserably in this pursuit. The author then talks about the software output of these supposed competitors: 
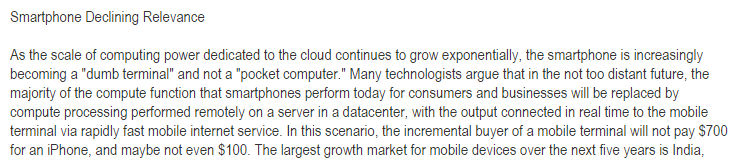
The author argues that the phone is becoming a “dumb terminal.”
However local processing power, DRAM memory, flash memory, screen size, and battery capacity have consistently increased over the past 5 years. It seems to me that the “terminal” is actually getting smarter, and mobile networks have a long ways to go before they can reliably and quickly process all of the data that is currently processed locally. Next comes the claim that the iPhone can't compete with cheap Android phones in India: 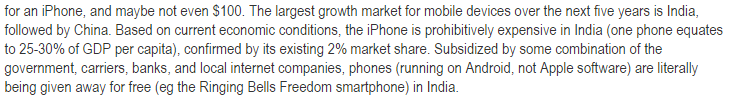
High prices relative to income in growth markets such as India are a problem for current sales, no doubt. However it is also an opportunity for the future. India should see 170m new smartphone users in the next 5 years, and Apple is working hard to lower the price to Indian consumers. This includes a rumored shift to local production that would save on taxes and transportation costs. As Apple’s local prices fall and Indian incomes rise, to me it seems inevitable that Apple will sell more devices, not less, in India over the next five years.
Insider selling and Capital Allocation The VIC author mentions $675 million of insider sales the past four years as indicative of negative sentiment. But Apple’s cash flow statement reveals $9.7 billion of stock compensation paid over the last four years. $675m is hardly a material portion of the equity that insiders have accumulated. Return on capital The author purports to show that Apple is “not earning its cost of capital.” Let’s look at his analysis: 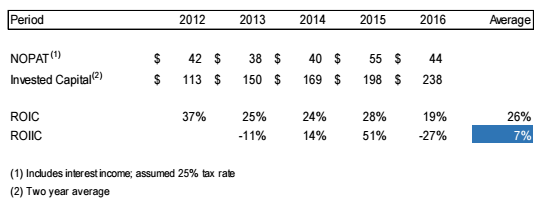
One thing you’ll notice here is that Apple’s invested capital has more than doubled over this time. But, as the author admits, this includes a huge pile of cash. Is that cash really invested in the business? No. It is merely stockholder money waiting to come home, and must be backed out to properly assess the investments Apple has made.
Our analysis assumes that all cash and securities don’t count towards the “assets employed” in the business. We then look at the operating income to determine the pre-tax return on the actual assets. Note that this does not give Apple credit for potential offsetting liabilities such as increases in accounts payable, which would lower the amount of capital they need to achieve a similar increase in operating assets. 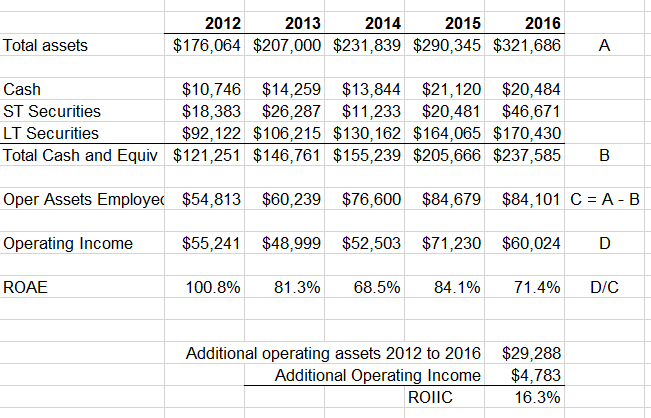
By our estimation, Apple runs at about a 70-80% return on operating assets, or about 50-60% after the same 25% assumed tax rate the VIC author uses.
The pre-tax return on incremental assets employed since 2012 is about 16%, a very respectable number. Summary and Conclusion In conclusion, we reject that Apple’s installed base or its moat are shrinking. In fact, Apple’s vertically integrated model has durable competitive advantages, most notably software and hardware harmony among its installed base. Google’s success with and comments around the Pixel validate Apple’s approach. The failure of Amazon, Facebook, and Microsoft to create their own closed smartphone ecosystems has left them more as partners than as competitors for Apple. Even Google is best described as a partner, with over ten billion in revenue from the iOS platform. India and other markets with low incomes should be seen as opportunities for Apple, not problems. And yes, Apple IS earning their cost of capital on new investments. Unfortunately, Apple is not as cheap as it was last year. But at about 14x earnings after backing out our estimate of net, after-tax cash, we think it provides substantially better value than the rest of the US stock market. We are grateful for your business and your trust, and a special thank you to those who have referred friends and family. There is no greater compliment. - Bireme Capital Bireme Capital LLC is a Registered Investment Advisor. Registration does not constitute an endorsement of the firm nor does it indicate that the advisor has attained a particular level of skill or ability. This piece is for informational purposes only. If not specified, quarter end values are used to calculate returns. While Bireme believes the sources of its information to be reliable, it makes no assurances to that effect. Bireme is also under no obligation to update this post should circumstances change. Nothing in this post should be construed as investment advice, and it is not an offer to sell or buy any security. Bireme clients may (and usually do) have positions in the securities mentioned. Comments are closed.
|