|
*We think.
Elon Musk is under contract to buy Twitter for $54.20 per share. The deal came together in April after a breakneck negotiation period, during which Musk was so eager to get the deal done that he waived his rights to due diligence. But since the contract was signed, markets plummeted and Twitter reported disappointing earnings. Based on his tweets, it appears Musk has gotten cold feet: 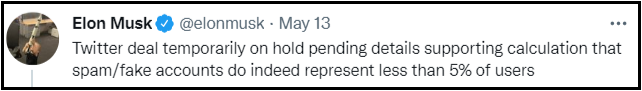
However, putting a deal under contract "on hold" is not a thing, and we think Musk has no legitimate reason to back out.
Nonetheless, markets appear to believe that he will be able to break the deal, or at least renegotiate a significantly reduced price. Today the stock trades at about $39, a massive discount to the deal price. This discount represents our opportunity. The Twitter board, if they fulfill their fiduciary duty, will sue Musk for "specific performance," a court order that will force him to close. We believe the board will win easily. In the end, we think Musk will have to buy the company at $54.20. At best, he will be able to negotiate a small discount which the Twitter board might take for deal certainty and to avoid a messy legal battle. If we're right, we will earn a >40% return on our <$37 purchase price in a 3-12 month timeframe. We went on Andrew Walker's "Yet Another Value Podcast" to discuss this in more detail, which you can listen to here. Bireme Capital LLC is a Registered Investment Advisor. Registration does not constitute an endorsement of the firm nor does it indicate that the advisor has attained a particular level of skill or ability. This piece is for informational purposes only. If not specified, quarter end values are used to calculate returns. While Bireme believes the sources of its information to be reliable, it makes no assurances to that effect. Bireme is also under no obligation to update this post should circumstances change. Nothing in this post should be construed as investment advice, and it is not an offer to sell or buy any security. Bireme clients may (and usually do) have positions in the securities mentioned. Advisory fees and other important disclosures are described in Part 2 of Bireme’s Form ADV. Different types of investments involve varying degrees of risk and there can be no assurance that any specific investment will either be suitable or profitable for a client’s investment portfolio. For current performance information, please contact us at (813) 603-2615. Fundamental Value had a solid quarter, essentially flat against a loss of -4.6% for the S&P 500. Our short positions made the difference. Our average short name was down -17% and the short book contributed 5.5% to the quarter’s return. FV has compounded at 24.7% net of fees since inception in 2016, outperforming the S&P 500 by 8.6% annually.1   Market commentary 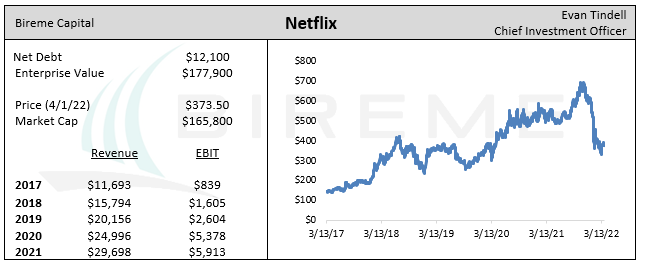 Elevator pitch
After disappointing Q1 guidance, the market gods have given us a tantalizing opportunity to buy Netflix stock at nearly a 50% discount from its peak. Investors seem to be extrapolating a one-quarter lull in subscriber growth into a multi-year issue, but we think Netflix will continue growing both users and ARPU for years to come. As a result of the drop, Netflix stock price is unchanged from Q4 of 2019. This is despite the company generating an estimated $5.5b of GAAP net income in 2022, up from $1.2b in 2019. The stock trades at a ~33x PE ratio today. This is atypically high for our investing style, but we do not think it is commensurate with Netflix’s quality as a company. This is the cheapest valuation NFLX has seen since 2011, when all of its profits were generated by the DVD-by-mail segment. The current price will look progressively cheaper over time: we conservatively estimate that the company will earn more than $30 per share by 2028 and generate billions of free cash flow along the way. A surprising purchase Our letters over the past two years have contained an unceasing drumbeat of bubble warnings and excoriations of the speculative frenzy in growth names. Thus, long-time readers will doubtless find themselves confused to see us buying a canonical growth stock that, while historically cheap, nonetheless trades at over 30x earnings. We took a substantial position in Facebook this week after it fell to less than $200 per share. It is not our first go-round with the company. We originally bought the stock in 2018. At that time, we thought it was strange that such a high-quality company had fallen to less than 20x earnings. In our 4Q18 letter, we wrote: We have watched Facebook from afar for some time. We have long been impressed at the pace they have grown the business, with revenues increasing from $5 billion to about $55 billion over the past six years. That growth has fallen to the bottom line as well, with profits multiplying from $1 billion to $20 billion. This analysis turned out to be accurate. Fundamental Value had its best year ever in 2021, returning 48.5% net of fees vs 28.7% for the S&P 500. The strategy has now compounded at 25.9% net of fees since inception in June of 2016, beating the market by 800 bps annually over more than half a decade. While this level of absolute returns is unlikely to be sustainable, we are as confident as ever in our ability to significantly outperform a still richly-valued equity market.1   Market commentary Fundamental Value was up 9.1% net of fees in the third quarter, handily eclipsing the S&P 500’s return of 0.6%. FV has had a spectacular first three quarters of the year, returning 38.6% net vs 15.9% for the S&P. FV has now generated a net return of 25.6% annualized since inception in 2016, outperforming the S&P by 9.2% annually.1   Market commentary Fundamental Value returned 27.0% net of fees for the first half of 2021, handily besting the S&P 500’s 15.2% gain. The strategy has now returned 24.9% annualized since inception, outperforming the S&P 500’s 17.2% return by 7.7% annually.1 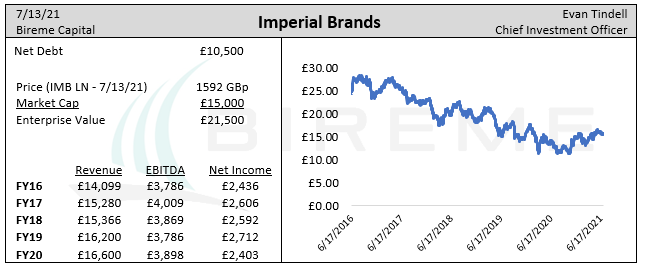 Elevator pitch At less than 6.5x earnings, Imperial Brands -- a UK tobacco firm -- is one of the cheapest stocks we have ever seen for a company with consistent profits. The stock has declined by about 50% since 2017 despite flat EBITDA and profit figures. We believe this is due to Imperial’s underwhelming operational performance combined with the market's infatuation with growth and ESG stocks, two themes which do not include Imperial. We think investors excluding Imperial on these grounds are falling prey to social conformity bias, which means they are simply aping their peers. At Bireme Capital, this is exactly the type of mistake that we seek to exploit in our Fundamental Value strategy. In contrast to our investor peers that see a no-growth, unsavory business, we see a company with stable cash flows, beloved brands, and high returns on capital, not to mention the ridiculously cheap earnings multiple. Due to the company’s 8.5% dividend yield, we expect Imperial’s stock to provide satisfactory investment returns regardless of where the stock trades in the short term. 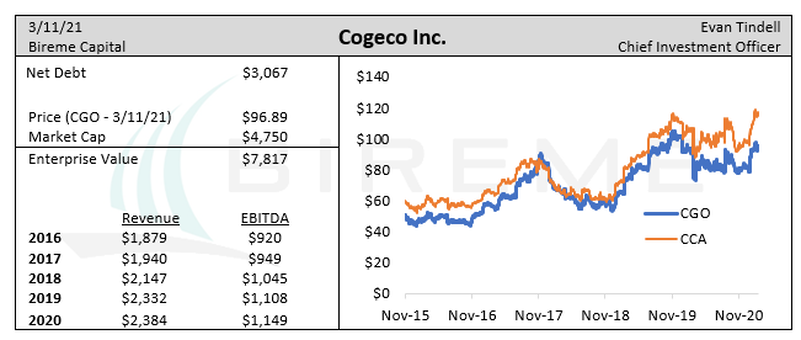 Elevator pitch
Cogeco Cable is an undervalued Canadian cable company, with shares of Cogeco Inc. trading at about 10x free cash flow and 7x EBITDA. For these multiples you get a company with a near-monopoly on high-speed internet in its Canadian footprint as well as significant exposure to US cable customers. Cogeco has more than doubled sales, EBITDA, and FCF since 2008, all without growing the share count. Long term, a strategic buyer is likely to purchase these assets at a significant premium, as Altice and Rogers attempted in the summer of 2020. After struggling during much of 2020, Fundamental Value enjoyed a phenomenal fourth quarter, soaring 47.1% net of fees compared to a gain of 18.3% for the S&P 500. FV finished the year with a gain of 29.8%, outpacing the S&P by 11.5%. Since inception, FV has returned 23.5% annualized vs 15.6% for the S&P 500.1 Part II: Anatomy of a Bubble |