|
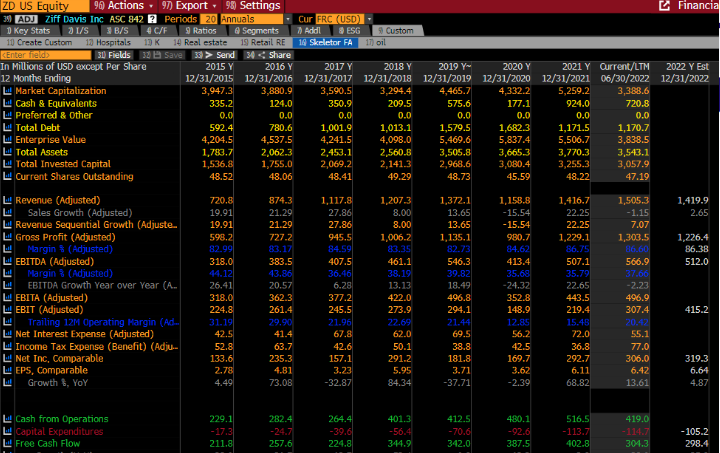
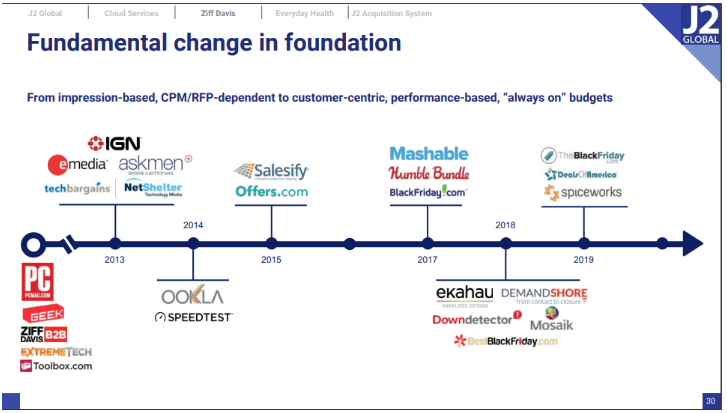
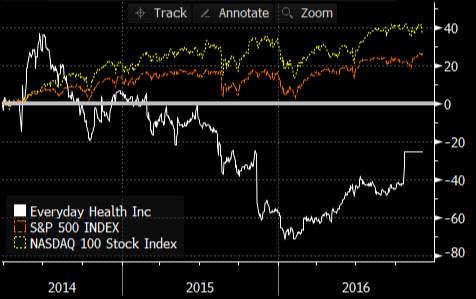
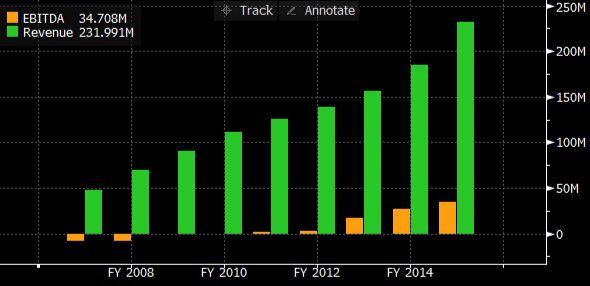
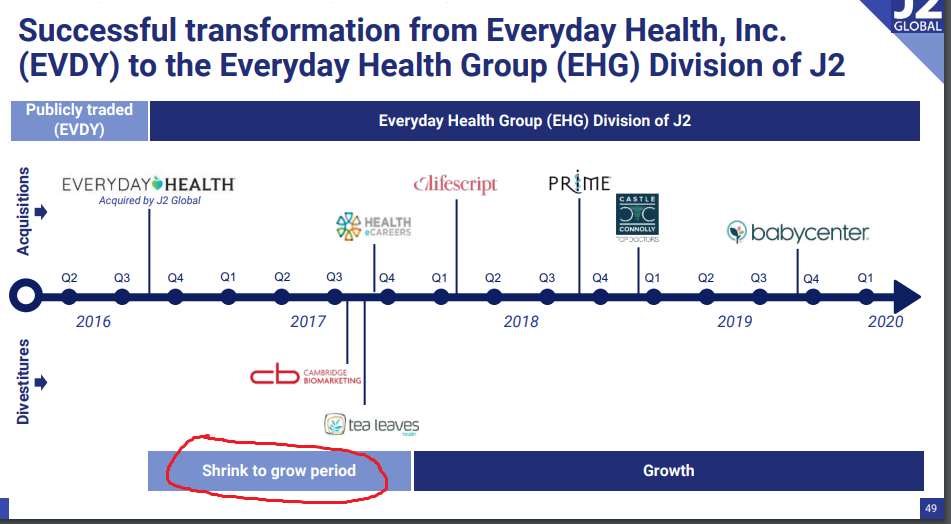
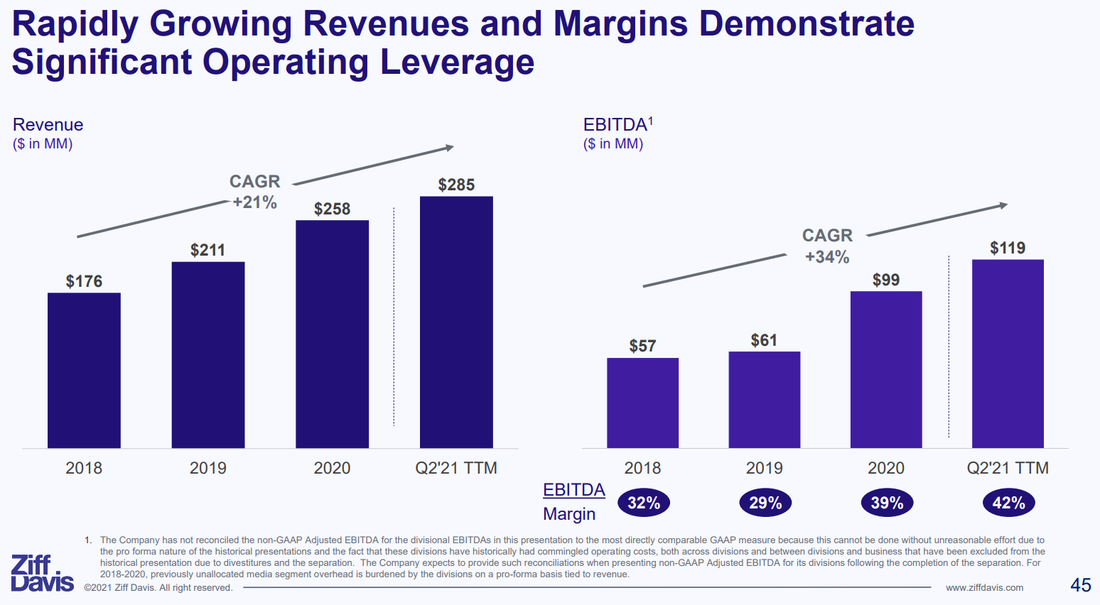
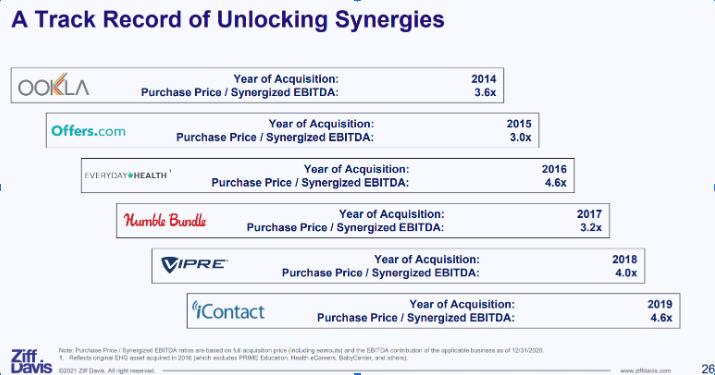
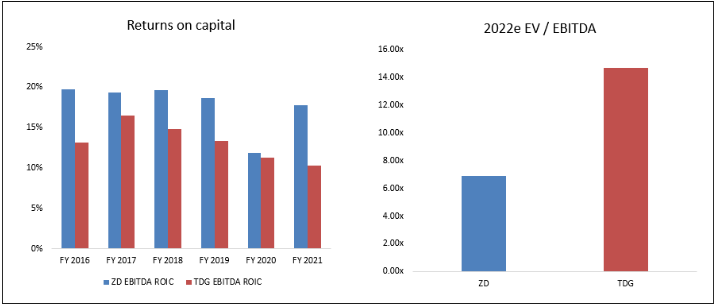
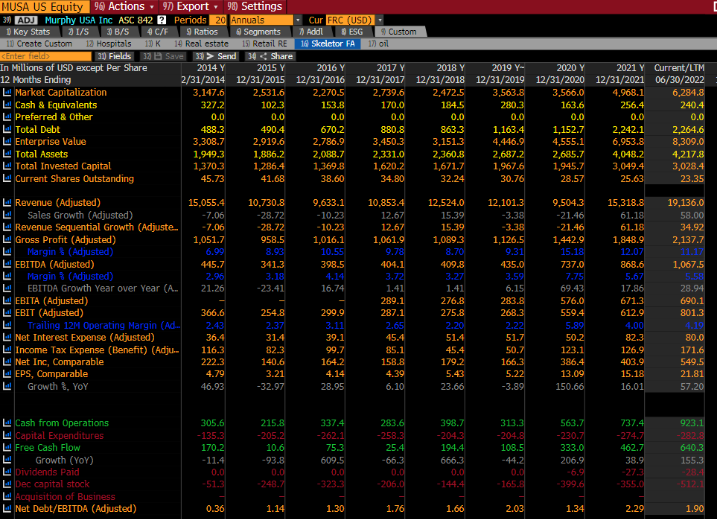
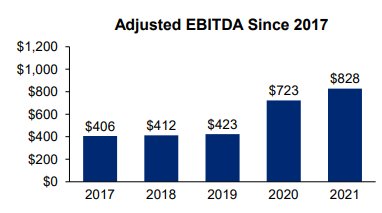
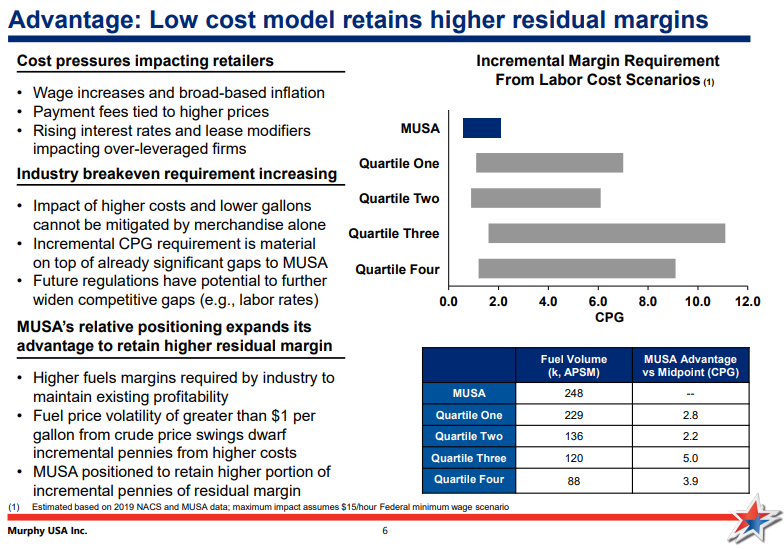
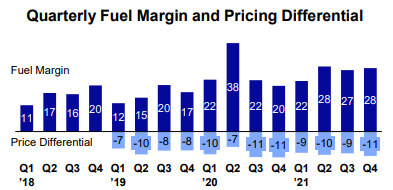
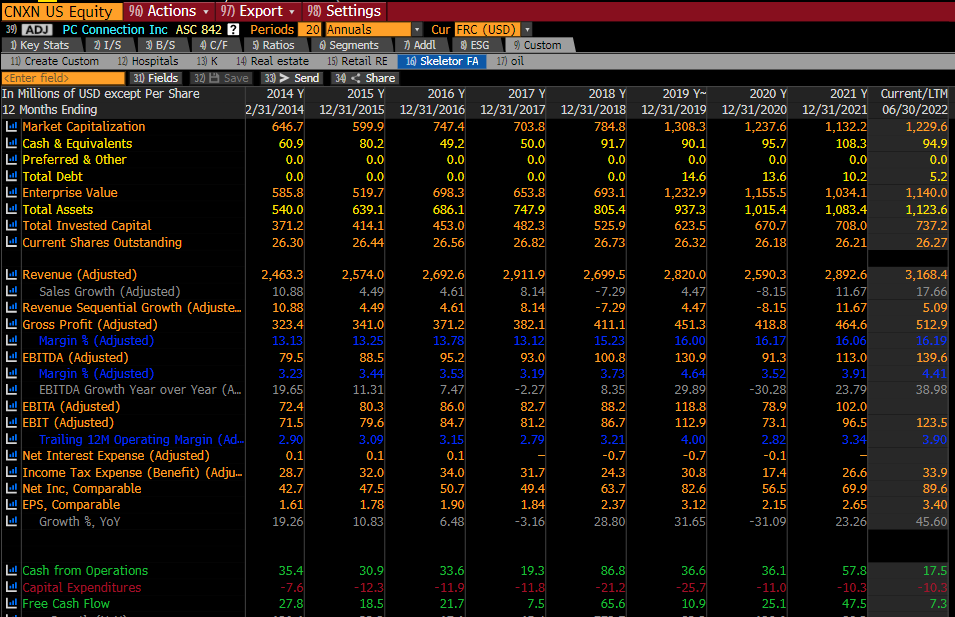
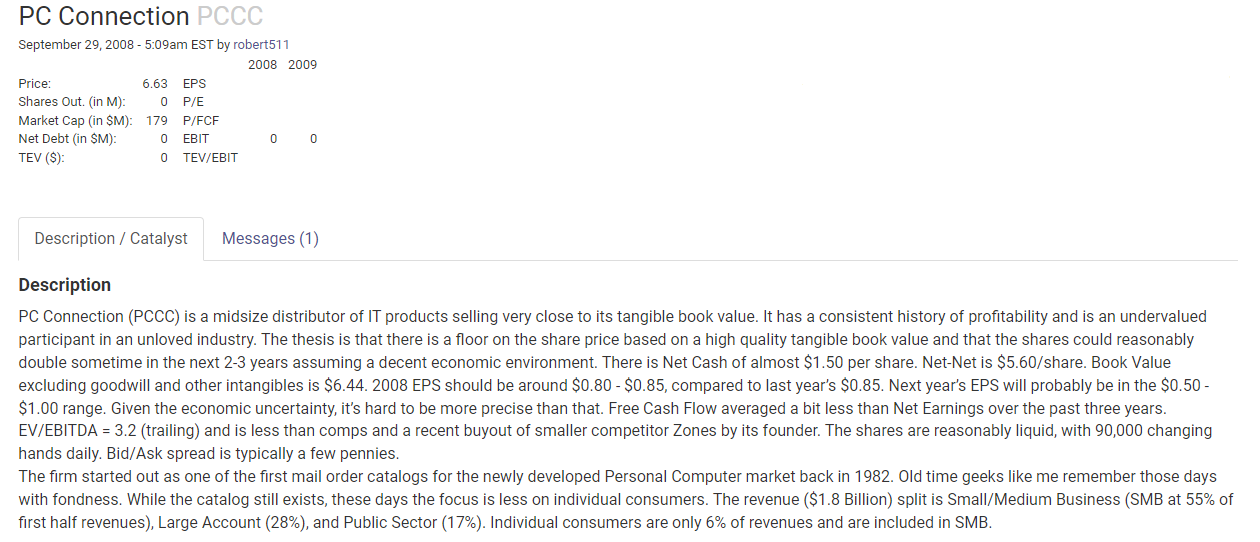
Ever heard of a company called J2 Global? I thought not. Originally, J2 Global was a company that sold fax-to-email subscription software. Over the years it took the profits from the subscription business – about $150-200m per year – and bought underperforming websites. They eventually built up a base of about $1b of non-fax revenues before separating into two publicly traded companies. Today the fax business is called Consensus Cloud Solutions (CCSI), and has a $950m market cap. Ziff Davis (ZD), the websites, are what’s left. The stock is down almost 50% since Nov 2021 and trades at a market value of about $3.4b. This comes to about 11x earnings and less than 7x this year’s EBITDA. This is quite a modest valuation for a firm that has grown revenues at its stable of websites 6x since 2014 (results below include the jettisoned fax business). The properties at ZD are IGN, Mashable, Ookla, PCMag, DownDetector, Everyday Health, and others. Below is a timeline of some of their key acquisitions from the JCOM 2020 Investor Day: The Mashable acquisition is instructive as to how Ziff Davis operates. Mashable was valued at $250m in 2016, but ZD managed to buy it for just $50m the next year. So ZD got an 80% discount vs the prior year’s valuation. The purchase was about 1x revenues, according to estimates seen by Variety. Today Mashable probably generates $50-75m in annual revenue according to estimates by similarweb.com. So slightly more than when it was purchased. But ZD operates with ruthless efficiency: the company has 35% adjusted EBITDA margins. This implies that today Mashable could be doing $20-25m of EBITDA. At a 10x valuation, this implies that ZD has generated a 4-5x return on its initial investment. I consider these estimates fairly conservative. Another notable purchase was the website everydayhealth.com, which Ziff Davis bought in 2016 for $465m. Like the Mashable deal, this was also a substantial discount to previous valuations. After going public in March 2014, EVDY had traded down more than 40% by October of 2016. It trailed the market substantially, with the S&P 500 up 26% and the Nasdaq up 39% over that time frame. This was not due to poor financial performance as far as I can tell. As of Q3 2016, EVDY had grown revenues 9% on a T12 basis and grew revenue 29%, 21% and 10% in the preceding years. Margins were decent too, with EBITDA margins clocking in at 11.9%. Perhaps initial expectations at the IPO were simply too high. ZD’s acquisition of the site was at 15x trailing EBITDA, but this is not the full story. ZD slashed costs, putting the segment into a “shrink to grow” period. This drove revenue below $200m. From the 2020 J2 Global analyst day: These cuts, while shrinking revenue, resulted in dramatically increased profitability. Meanwhile, ZD bolted on smaller acquisitions like BabyCenter. Today, the Health Group at ZD now has around 100m monthly unique visitors and is one of the largest contributors to ZD results with ~$120m of EBITDA. Deals like Mashable and Everyday Health seem to demonstrate ZD's prowess in acquiring these underperforming and low-profitability websites. This strategy has few publicly traded competitors. But despite the uniqueness of their strategy, we see no reason why it can't be successful, In fact, it strikes us as a little bit similar to what Constellation Software does in niche SaaS or Transdigm does in airplane parts. One advantage ZD has is that it appears there is not much competition in acquiring these assets. ZD claims they have averaged purchases at 5x EBITDA and highlights a number of deals that were even cheaper than that on a fully-synergized basis: You should never trust a company with data like this, because they could be cherry picking. Cheap acquisitions must show up in the final numbers. In ZD’s case, the consolidated financial statements show that 5x EBITDA is a reasonable estimate. If we exclude cash of around $750m, total operating assets at ZD are $2.75b essentially all of which was acquired. This figure is about 5.2x expected EBITDA for this year. In other words, EBITDA returns on invested capital are around 20%. While this can’t compare to Constellation’s near 50% EBITDA ROIC, it compares quite well against Transdigm’s ~15% EBITDA returns. Despite better returns on capital, ZD trades at half the EBITDA multiple of TDG. We are sticking ZD on our watchlist and will be following it closely going forward. If you saw my post from last week, you’ll know that I have decided to study at least one new company every day and post on it. I’m a little behind already, but today’s second post looks at Murphy USA (ticker MUSA). Murphy USA runs gas stations, and had about 1700 locations at YE 2021. They were a 2012 spinoff from Murphy Oil, a $10b enterprise value oil producer based in Houston. At the time of the spinoff, the firm listed the following “competitive strengths” “Strategic relationship with Walmart'': Roughly 1000 of their locations are located adjacent to Walmart, which drives significant traffic for MUSA. They collaborate with Walmart on a fuel discount program. “Cheap gas prices”: Their business is built around efficiency, high traffic, high volumes, and low prices. They are also a leader in low-priced tobacco products. “Low-cost operating model”: MUSA’s small-footprint stores, with a focus on fuel sales, drive low capital and maintenance costs. Only one or two attendants need to be present during business hours. Also, they own their locations so do not incur rent expense. “Advantaged fuel supply”: MUSA claims to source fuel “at or below industry benchmark pricing”. I’m not sure how much I believe this is a real advantage relative to peers. At the time of the spin, the company did about $300m of EBITDA at just under 1200 locations. Their footprint has grown relatively slowly, building stores both adjacent to and independent from Walmart locations. In 2019, the final pre-COVID year, the company did $435m of EBITDA out of 1500 units. The Walmart agreement ended a few years back, and now they are focused on freestanding locations for growth. The valuation is tricky. On 2022e earnings, the stock looks cheap at about 11x PE. The problem is that earnings are at a cyclical peak, having ballooned from $160m in 2019 to $570m for 2022e. Below are the adjusted EBITDA figures they present in their most recent investor deck. Did anything fundamentally change in this business to create this hockey stick in earnings? Or is this ephemeral? In most cases, margins distributing pure commodities, like gasoline, should be cyclical. The company argues that fuel margins are “expected to settle at a higher equilibrium”. They claim that most fuel retailers are experiencing labor cost inflation, and must therefore raise their per-gallon price. But since MUSA locations do very high volumes, they can raise their prices less and continue to generate high fuel margins with best-in-class consumer pricing. I don’t buy this line of argument. In the model above, MUSA calculates that their competitors need to generate 1-11 cents per gallon more in gross profit to offset a minimum wage increase to $15 per hour, which would be a roughly 30% increase for gas station attendants according to Payscale. But passage of a $15 min wage is seen as a remote possibility. Also, it is not clear to me why stores couldn’t raise prices on convenience store items (where much of gross profit comes anyways), rather than gas prices. Finally, MUSA’s fuel margins have already increased >10c per gallon, so seem sure to fall regardless. I find it hard to believe that a bout of sub-10% inflation has somehow permanently changed the profitability of selling gasoline to consumers. We expect margins to fall back to historical levels. And if margins do fall back to historical levels, MUSA seems quite richly valued. The company trades at about 40x 2019 earnings. We’re going to pass on this one. If you haven’t heard, Twitter investors may be getting a slug of cash they need to put to work. This is a good thing, but it means we need to sharpen our pencils on where to reinvest this cash. The timing is decent, with the market down more than 20% and value indices also down double digits on the year. It’s time to turn over some rocks. I plan to read about at least one new company every day this month and will post the results here. First up is a company called PC Connection (ticker CNXN). Founded in 1982 to sell Macintosh computers, the company was named as the second fastest growing company in the US in 1987. In 1998 they IPO'd after growing 65% in the previous year. At year end 1999, the company had $1.1b of trailing sales, $22m of net profit, and a $550m market capitalization. After the tech bubble burst the company struggled with declining sales, and its market cap bottomed out at a mere $100m. This was the beginning of a very slow comeback in terms of both profits and valuation. Today the firm has a market cap of $1.2b on $3.3b of sales and $70m of trailing net income (about 17x PE). The share price has gone essentially nowhere since 2019. The business hasn’t changed that much, with PC sales still accounting for nearly half of revenue. The rest is made up of accessories, servers, and software. This is, unsurprisingly, a low margin operation, and EBIT margins have varied between 2.5% and 4% in recent years. But despite these low margins, high inventory turnovers and low fixed capital requirements give the firm around a 10% return on equity. Revenue growth has been rather anemic over the past decade, with sales increasing from $2.2b to $2.9b. This makes sense given the overall saturation of PCs in the modern economy as well as tough competition from both Amazon and OEMs selling direct to consumers. One thing that is notable about the stock is that almost no one talks about it. SumZero (a well-trafficked buy-side investment site) has zero writeups, and the most recent one on Value Investors Club (“VIC”) is from 2008, when it went by a different ticker (PCCC). That 2008 VIC writeup cites the stock’s valuation of “near tangible book value” as a key component of the thesis. In other words, it was not a pitch based on the quality or growth of the business. Such a thesis wouldn’t really apply in 2022, with the stock trading at around 2x book value. The stock also traded at about 3x EBITDA and 6x earnings in 2008, much cheaper than today. Sell side coverage is also non-existent, with only Sidoti and Raymond James covering the company. Clearly, this is the type of boring, ignored stock that could get mispriced.
Still, given the business they are in, I fail to see why I should pay more than 10x earnings for this stock. If you want to invest in a business that sells PCs and accessories, why not own DELL or HPQ at 6-7x earnings? I’m going to pass on this one for now. Let me know if I’m missing something. |
What this isInformal thoughts on stocks and markets from our CIO, Evan Tindell. Archives
December 2023
Categories |
Telephone813-603-2615
|
|
Disclaimer |

